Approximately 6 months off
from the official start of the COVID-19 outbreak in China (although
the actual start of the outbreak is debated) and over 3 months
from the initial
nationwide shutdown in the United States, there is much uncertainty
as to the true mortality rate of the disease. It is first important to define
terms, as there are different types of “mortality” or “fatality” rates.
Defining Case Fatality Rate vs. Infection Fatality Rate
As shown in Figure 1, the
reported number of COVID-19 cases does not necessarily represent the true
number of infected individuals. The confirmed number of cases (positive tests
for active infection) is smaller than the number of probable infected (sick
patients believed to be infected based on symptoms and likely exposure but who
never received a diagnostic test), which is smaller than the actual number of
total infected individuals.
 |
Figure 1. Relationships between measured number of COVID-19 cases via different metrics and number of deaths (not necessarily to scale) |
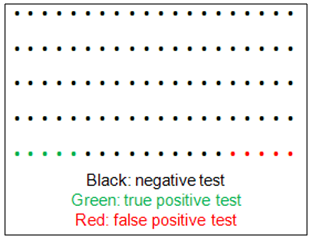
A case fatality rate(CFR) is the proportion of deaths from a disease compared to the number of people diagnosed.


 |
| Figure 2. Visual representation of Case Infection Rate (CFR) and Infection Fatality Rate (IFR) |
There is variability in reported mortality
rates
Reporting of fatality rate (or mortality rate) often does
not distinguish between CFR and IFR, which contributes to the uncertainty. Initial
data from the outbreak in China suggested a mortality
rate of 2% which was later
updated to 3.4% as of March. It is likely that there will
not ever be a fully accurate IFR because the reported mortality rates vary
greatly across demographics, age groups, and countries. It is well-understood
that like many diseases, including
influenza, the fatality rate increases exponentially with age. Original
data from China reported IFR ranging from 0.2% in 10 to 39 year olds to 14.8% for
those over 80, as shown in Figure
3.
 |
| Figure 3. Death rate by age as of Feb, 2020 based on data from China. (Source: Worldometers.info) |
Data
from New York City in May shows that 49% of deaths are from
individuals 75 and older, with 22% of deaths coming from 45-64 year-olds and 25%
from 65-75 year-olds. Only 4.5% of deaths were under 45, and interestingly both
the China and NYC data show that mortality is almost completely absent for
young children. 75% of COVID-19 deaths in NYC were associated with a known relevant
underlying condition.
What has especially made pinning down the COVID-19
fatality rate has been the extremely large variance across the
world in CFR. Data
from May 9th shows that CFR varied from a minuscule
0.1% in Singapore to 6% in the U.S. to a staggering 16.3% in Belgium. It is
likely that at least a significant contributor to the differences in CFR across
countries (or across states in the U.S.) is incomplete testing. Several
studies show the rate of asymptomatic cases between ~40% and
80%, implying that the number cases could be undercounted by 2-5x (and
therefore the IFR could be substantially lower than the CFR). Even that
adjustment may be an underestimate, since many people with only mild to
moderate symptoms are also likely to not have been tested, especially earlier
in the crisis when accessibility to testing was more restricted, at
least in the U.S. On the other hand, limited access to
testing could also result in undercounting of deaths, since it is likely that
many sick individuals have died without ever receiving formal COVID -19
diagnoses.
Antibody Testing Results Must Be Interpreted
With Caution
A potential answer to solving the “IFR gap” is the
promise of widespread antibody testing. Unlike the nasal
swab for active coronavirus infection, antibody
blood tests can identify past infections, as indicated
by the presence of active antibodies against the virus (and
at least plausible medium-to-long-term immunity). With
widespread, accurate antibody testing it may be possible to obtain the true
infection rate and therefore better estimate the IFR (for a given population).
Until recently however, antibody testing has been of poor
quality with little to no regulation. The accuracy of any
diagnostic test is determined by the sensitivity (or absence of false
negatives) and specificity (absence of false positives). For active coronavirus
tests a high sensitivity is very important, because it would be dangerous for
tested individuals to believe they are uninfected while they were in fact a
risk to others. In contrast, for antibody tests the specificity rate is more
important, because a false positive would infer a faulty sense of immunity. Due
to a quirk of statistics, the
true accuracy of a test result is not only dependent on the test itself but
also the prevalence in the population. While the false
positive/negative rate is inherent to the test, the relative likelihood that a
test result is correct is directly related to the population prevalence (how
widespread the disease actually is).
As an example (shown in Figure 4): If a test has a
specificity of 95% (meaning a 5% false positive rate), if only 5% of the
population was truly infected then there is actually over a 50% chance that a
positive antibody result will be incorrect. This is because out of a population
of 100 people, if only 5 actually had COVID-19 and 95 did not, then even though
only approximately 5 out of 95 will receive a false positive test, the
individuals cannot possibly know if they are one of the 5 true positives or the
5 false positives. If prevalence is higher, the relative population of true
negatives is smaller and therefore a positive test is more likely to be correct
(Figure
5).
 |
| Figure 4. An example of antibody test results given 95% specificity and 5% prevalence (assuming 100% sensitivity) |
 |
Figure 5. Example of calculating a true positive rate based on test specificity and population prevalence.(Source: NPR.org) |
This can lead to some circular reasoning when attempting
to use antibody tests to measure population prevalence, since the percentage of
true tests is high only if the true prevalence rate is high (which is unknown).
New York State released results from widespread antibody data on May 2nd
showing that 12% of the statewide population and 20% of NYC was positive for
COVID-19 antibodies. However, at that time many of the tests on the market had a
5% or higher false positive rate. Therefore, at a 5% false positive rate the
true prevalence in New York State was likely only 6-7% while at a 10% false
positive rate the true prevalence was likely under 4%. Luckily, FDA has since
improved oversight of antibody testing and two newer tests from Abbott and
Roche
claim close to a 0% false positive rate. Nevertheless, results from earlier
prevalence studies should be questioned.
COVID-19 is Much More Dangerous Than Flu… By
Any Metric
Many critics of the public health response to COVID-19
have cited these antibody studies to claim that the
true IFR is over an order of magnitude lower than reported and
is therefore similar to influenza. As shown in Figure 6, the
COVID-19 mortality rate is 5-12x more deadly across different lifestages
compared to the flu based off CDC data from late March
(presumably these figures represent CFR, at least for COVID-19). Based
on IFR, the relationship still holds, with many COVID-19 IFR
estimates (based on the potentially flawed antibody testing data cited above)
of 0.5% and up, compared to 0.02% - 0.05% for flu.
 |
| Figure 6. Comparing mortality rates between flu and COVID-19 (assumed to be CFR). (Source: BusinessInsider.com, graphic by Shayanne Gal). |
Another important comparison often absent from the
discussion is the relative hospitalization rates. As an indirect measure,
population hospitalization rates over 6 weeks of the COVID-19 pandemic compared
to 6 weeks during a flu season suggests that COVID-19
hospitalization rates are 20-times higher. Among confirmed
COVID-19 cases, data from late April showed a staggering
13% hospitalization rate, although that number is likely
inflated due to reduced testing at the time (only severe cases were able to get
tested). In comparison, the previous 3 flu seasons average to a hospitalization
rate of 1.6%, almost 10-fold less and mirroring the differences in fatality
rate.
What is the actual COVID-19 IFR?
Given all these factors, it may be impossible to pin down
a single IFR value that applies to everyone and is consistent across time.
Worldometers.info, which is among the best resources for daily tracking of
COVID-19 cases across the world and the U.S., attempted to calculate an IFR
using NYC antibody data to estimate the amount infected and NYC excess deaths
to determine the true deaths from the disease. I already addressed the
possibility of antibody data estimating the prevalence of infection, but there
are potential issues with the use of excess death as well. Excess death
compares the number of deaths above seasonal baseline levels as an indirect
measure of deaths from a unique cause. This method was used to estimate
excess deaths in Puerto Rico following Hurricane Maria in 2017. The issue
with excess deaths is that they are “all-cause”. In other words, they may not
represent only deaths directly related to the disease but also indirect
mortality. For example, it is possible that a substantial percentage of excess
deaths may be due to patients not being admitted to the hospital for unrelated
conditions. Therefore these deaths may be attributed to the pandemic, but not to the disease itself.
Worldometers.info combined confirmed deaths, probable
deaths (no confirmed positive lab test for the virus, but symptoms and likely
exposure suggests COVID-19 was the cause), and excess deaths and compared the
sum to the extrapolated estimate of infected NYC residents from antibody data. The
result
was an estimated IFR of 1.4% (data as of May 1st). A recent
publication from early June (not yet peer-reviewed) estimated
a median of only 0.25% IFR (with a wide variance) across all age groups with a
median of 0.05% for those below 70 years old. The CDC
provides a “best estimate” CFR of 0.4% and a calculated IFR of 0.26% (based
off assumption of 35% asymptomatic cases) as of late April, very similar to the
cited study. On the higher end of the spectrum, a great review article published
mid-June in the academic journal Nature covering many of the issues discussed
here suggests that most
studies appear to converge around an IFR of 0.5 – 1%, meanwhile a brand new
study posted online in mid-June (also not yet peer-reviewed) derived an IFR of 0.64% based
on data from Switzerland. That study also derived age-specific (but not
risk factor-adjusted) IFRs of 5.6% for adults over 65, 0.14% for those 50-64,
and only 0.0092% for ages 20-49.
Conclusions and Long-Term Health Concerns
While there is certainly much remaining uncertainty, the
available studies so far (as of the time of publication in late June, 2020)
indicate that the COVID-19 IFR is likely ~ 0.25 – 0.75%. As testing has
increased greatly in the past few months, the CFR appears to be approaching the
IFR. The U.S.
showed a CFR of approximately 6% in early May, while despite a recent surge
in cases the daily CFR is now approximately 1% (as of June 22, 2020) and the overall CFR is down
to 2.7%. In addition to increased testing, it is also possible that the
initial rapid wave of the virus targeted highly susceptible groups especially
hard, and therefore they may have been overrepresented in early mortality data.
The continuous discovery of somewhat effective treatments for COVID-19 such as remdesavir and dexamethosone
also contribute to the decreasing mortality rate over time.
The good news is that it appears COVID-19 may be much
less deadly than initially feared. It is still important to note however that
both the mortality rate and hospitalization rate appear to be in the range of
10x higher compared to the flu. While influenza is primarily a respiratory
disease and patients who recover are back to normal relatively quickly, there
is evidence of sustained long-term damage following “recovery” from COVID-19.
An additional concern from infection is the potential for “hidden effects” that
may not present until years or decades later. SARS-CoC-2 (the virus behind
COVID-19) attacks the body through the binding of a receptor called ACE2, which
is broadly expressed throughout the body. ACE2 is especially highly
expressed in kidney and testis, indicating that otherwise
mild or asymptomatic infection could plausibly lead to kidney disease or infertility
later in life.
The whole world is going through this crisis together,
and we can all help each other by trying to be responsible citizens. Even if we
are not a high risk, we may be carriers for others who are. Data
suggests that consistent mask-wearing may have a stronger mitigating effect than
even originally believed. When combined with social distancing and
minimizing crowded indoor interactions, the global effects of COVID-19 can be
reduced and we can survive the pandemic as safely as possible.
Thanks on your marvelous posting! I seriously enjoyed reading it, you can be a great author. I will make sure to bookmark your blog and definitely will come back very soon. I want to encourage yourself to continue your great writing, have a nice evening!
ReplyDeleteHello, all the time i used to check webpage posts here early in the morning, because i love to learn more and more.
ReplyDelete